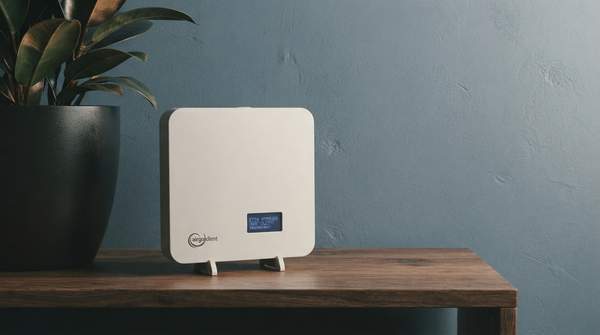
Smart home air quality monitors are not one device but several small instruments sharing a case. Each pollutant they report — particulate matter, carbon dioxide, volatile organic compounds — is measured by its own sensing element working on a different physical principle, and each has distinct strengths and blind spots. Once you understand that optical sensors count particles, infrared sensors measure gas absorption, and metal-oxide films react to airborne chemicals, the numbers on your monitor's app stop being abstract and start telling a story about your home: when it is under-ventilated, when something is burning or smoldering, and when a product you brought indoors is off-gassing. This guide covers common consumer-grade indoor monitors only — not professional or industrial equipment — and is not medical advice; readers with health concerns should consult a doctor.
How Air Quality Monitors Work: Sensor Technologies
Most consumer monitors split their sensing work across a few well-established technologies, a mapping that sensor and instrumentation references describe consistently. Optical light scattering handles particles: a fan or natural airflow draws air through a small chamber where a light receptor detects light scattered by passing particles, and the particle concentration is estimated from that signal. The South Coast air quality management district's sensor evaluation program explains that basic optical counters correlate the percentage of time the sensor reports a low pulse against a manufacturer-supplied concentration curve, while higher-sensitivity versions quantify based on the strength of the detected scattering.
Gases get their own dedicated elements. Carbon dioxide is typically measured by non-dispersive infrared, or NDIR, absorption: an infrared light source shines across a sample of air, and the amount of light the CO₂ molecules absorb serves as the indicator of their concentration — the same absorption principle, described by sensor manufacturer Rika, that infrared sensors apply to gases including methane and VOCs. Volatile organic compounds are commonly measured by heated metal-oxide films or electrochemical cells, while electrochemical cells also serve gases like carbon monoxide, nitrogen dioxide and ozone, according to Tractian's sensor glossary. Clarity's monitoring-technology overview likewise notes that different air pollutants require different monitoring methods, with electrochemical sensors measuring certain gases such as nitrogen oxides and carbon monoxide.
The practical consequence for a buyer is that no single sensing element does everything, and a monitor's spec sheet tells you exactly which instrument — and therefore which pollutant — you are actually buying. A device without an NDIR sensor cannot meaningfully report CO₂, however attractively it packages its other readings.
Key Pollutants Detected and Their Health Implications
The three pollutant families most consumer monitors target are particulate matter, carbon dioxide and VOCs, and their relevance to a home differs sharply. Particulate matter at the 2.5-micron scale — PM2.5, along with the coarser PM10 that some devices also report — is measured by the optical scattering method described above. A PM2.5 reading is a count of suspended fine particles, which rise and fall with cooking, combustion, dust-generating activity and air exchange with outdoors.
Carbon dioxide is a ventilation marker more than a contamination marker. AirGradient, a monitor manufacturer, notes that houses with insufficient fresh-air ventilation can accumulate very high CO₂ levels, which can cause headaches and tiredness and greatly impact cognitive performance — effects typically observed at elevated indoor concentrations. Because people themselves exhale CO₂, a rising indoor curve usually means occupied rooms are not exchanging enough air, not that something dangerous has been released.
VOCs are a broader and trickier category: these sensors typically respond to total VOCs, a combined signal from many airborne organic chemicals rather than any individual compound. HouseFresh's testing coverage notes that VOC sensors are expensive and hardly ever included in budget monitors, so their presence on a consumer device is itself a meaningful feature. A rising TVOC reading generally points to an indoor emission source — products, materials, or activities — rather than outdoor conditions.
Pollutant-Sensor-Impact Explanatory Model
The table below maps each common pollutant to the sensor technology that measures it, the physical principle that makes the measurement possible, and what an elevated reading most plausibly means in a home. Use it to reverse-engineer your own device's spec sheet: find the pollutant, and the sensor column tells you which instrument is doing the work.
| Pollutant | Common Sensor Technology | Working Principle | What a High Reading Can Mean |
|---|---|---|---|
| Particulate matter (PM2.5, PM10) | Optical particle counter using laser scattering | A light receptor detects light scattered by particles passing through the beam; concentration is estimated from the low-pulse time percentage or, in higher-sensitivity versions, the strength of scattering | Elevated particle counts from indoor combustion, cooking or dust-generating activity, or poor filtration and air exchange — the most direct signal of a particle source in or near the home |
| Carbon dioxide (CO2) | Non-dispersive infrared (NDIR) absorption sensor | An infrared source shines through the air sample; the amount of infrared light absorbed by CO2 molecules indicates their concentration | Insufficient fresh-air ventilation in occupied rooms — associated with headaches, tiredness and impaired cognitive performance at elevated indoor levels; NDIR sensors are known for long lifespan and stability |
| Volatile organic compounds (VOCs) | Heated metal-oxide film or electrochemical cell | The sensing element reacts to airborne organic chemicals and reports a combined total-VOC (TVOC) signal rather than individual compounds | An indoor emission source such as products or materials off-gassing; a relative rise signals that something in the room is releasing chemicals worth tracing to its source |
Two caveats belong beside this map. First, other optical methods exist for particles, but laser scattering is what common consumer devices use. Second, these are general patterns of meaning; individual readings depend on placement and conditions, and the glossary from Tractian cautions that drafts, humidity and cross-sensitivity can distort air readings, so placement near known sources at breathing-zone height matters as much as the sensor itself.
Interpreting Your Air Quality Data
The core interpretive shift is from absolute numbers to trends over time. Airthings, whose guide to home air quality testing is written by Annabel Robertson, puts the point directly: continuous monitoring gives you a more accurate picture of your air over time than a single spot test. A monitor that samples every minute for weeks can show you that CO₂ climbs every night in a closed bedroom, that PM2.5 spikes when a particular room is used for cooking, or that TVOC readings have been slowly rising since a new piece of furniture arrived — patterns that no one-off measurement could reveal.
Read each pollutant's trend as a question rather than a verdict. A CO₂ curve that rises during occupancy and falls when windows open is a ventilation question. A PM2.5 spike with a sharp onset and slow decay is a source question: something introduced particles, and the timing usually identifies what. A gradual, persistent TVOC elevation is a materials question, inviting you to inventory what changed in the room before the rise began. The monitor's job is to localize the cause in time; the trend shape is the clue.
The same Airthings guidance also suggests what to look for if you have no monitor at all: warning signs such as condensation on windows, musty smells, visible mold, excessive dust, a stuffy feeling, or symptoms like headaches and poor sleep that improve when you leave the house. These are anecdotal warning indicators, not measurements, but they align with what a monitor would quantify — and they are a reasonable sanity check on whether a device's readings match your lived experience of a space.
Taking Action: Improving Indoor Air Quality
Each pollutant family rewards a different response, and matching the action to the trend is what turns data into a healthier home. For high CO₂, the action is fresh-air ventilation: increasing air exchange when readings climb in occupied rooms, since the underlying cause in most homes is insufficient fresh air rather than a pollutant release. For high PM2.5, the response combines source removal and filtration — addressing the activity producing particles and running air purification while levels decay. PurpleAir's overview of monitor operation notes that smart home systems, including HVAC units and air purifiers, can be equipped with air quality sensors for continuous tracking, and that monitor data can feed home automation — in practice, a rising PM2.5 or CO₂ reading can trigger ventilation or purification automatically.
For high TVOC readings, source identification comes first: since VOC sensors report a combined signal, the practical move is to remove or isolate newly introduced products and materials and watch whether the trend falls. Lascar Electronics' guidance for indoor air quality management frames the general principle — with continuous monitoring you track pollutant levels and make informed decisions to improve your environment. PurpleAir also points out a community dimension: registering a monitor on a public air quality map lets its data support scientific research and local policy, and lets you compare your readings against nearby devices for context — including outdoor conditions as they bear on what drifts indoors.
Actionable Steps for a Healthier Indoor Environment
The decision this article supports is simple: continuously monitor indoor air to identify trends and patterns, then respond to high readings of PM2.5, CO₂ or VOCs with ventilation, air purification or removal of the pollutant source. These are general responses, and their effectiveness varies with the source and severity of the pollution. The measurable indicator of success is a sustained decrease in PM2.5, CO₂ or VOC levels on the monitor after you implement a corrective action — open the windows tonight and the CO₂ curve should visibly flatten; pull the suspected product out of a room and TVOC readings should trend down over the following days. If the readings do not respond to the action, the source is elsewhere, and the trend data itself will tell you where to look next.
Sources
- What Are the Different Types of Air Pollution Sensors? — Rikasensor
- Air Quality Sensors — Tractian
- How do air quality monitors work? Sensors, methods, & technology — Clarity
- Airgradient
- The best air quality monitors we have tested — HouseFresh
- How to test indoor air quality at home: what to measure and how — Airthings America Inc.
- An Inside Look at How Air Quality Monitors Work — Purpleair